Securing safe drinking water remains a pressing public health challenge in Bangladesh, where groundwater quality is increasingly undermined by a combination of natural factors and human-induced activities. This study examined the drinking water quality of two female residential halls such as Bangamata Begum Fazilatunnessa Mujib (BBFM) Hall and Aparajita Hall (AP) at Khulna University over a six-month period. An integrated approach was applied, combining physico-chemical and microbial analyses with multivariate and risk assessment methods such as Pearson’s correlation, Water Quality Index (WQI), Principal Component Analysis (PCA), Pollution Index of Groundwater (PIG), Quantitative Microbial Risk Assessment (QMRA) and Chemical Health Risk Assessment. Physical analyses indicated neutral to slightly alkaline water, with moderate electrical conductivity (EC) and total dissolved solids (TDS) reflecting natural geogenic influences. Chemical evaluation revealed a sodium-chloride-bicarbonate-dominated profile, while nitrate, phosphate, and sulfate remained within safe limits, though salinity indicators highlight potential long-term risks. Microbiological assessment detected total coliform (TC), fecal coliform (FC) and Escherichia coli (E. coli ) above World Health Organization (WHO) thresholds, indicating fecal contamination and immediate public health concerns. PCA and correlation analyses identified salinity, carbonate buffering, and phosphorus enrichment as key hydrochemical drivers, whereas the WQI ranged from 42.66 to 51.71, classifying most samples (except BBFM 4) as good. The PIG values (<1.0) indicated insignificant pollution. QMRA estimated annual infection probabilities of 12% to 44%, far above the WHO benchmark (≤10⁻⁴), underscoring cumulative exposure risks. Chemical health risk assessment confirmed no significant non-carcinogenic threat from nitrate or sodium intake. These results indicate that although the water is largely safe from a chemical standpoint, it carries considerable microbial health risks. Based on these findings, a comprehensive management approach is advised, incorporating immediate actions, short to mid-term interventions, and long-term infrastructural improvements, alongside the implementation of a Water Safety Plan (WSP) to ensure safe and sustainable drinking water in university residential facilities.
| Published in | Journal of Water Resources and Ocean Science (Volume 14, Issue 6) |
| DOI | 10.11648/j.wros.20251406.16 |
| Page(s) | 229-247 |
| Creative Commons |
This is an Open Access article, distributed under the terms of the Creative Commons Attribution 4.0 International License (http://creativecommons.org/licenses/by/4.0/), which permits unrestricted use, distribution and reproduction in any medium or format, provided the original work is properly cited. |
| Copyright |
Copyright © The Author(s), 2025. Published by Science Publishing Group |
Drinking Water Quality, Microbial Contamination, Water Quality Index (WQI), Pollution Index of Groundwater (PIG), Quantitative Microbial Risk Assessment (QMRA), Khulna University
Parameter Type | Parameters | Analytical Methods | Instrument/Technique |
|---|---|---|---|
Physico-chemical | pH | Electrometric | pH meter (M106MAX, Milwaukee) |
EC, TDS | Electrometric | EC/TDS meter (AD 332, Adwa) | |
Turbidity | Nephelometric | Turbidity meter | |
DO | Electrometric | DO meter | |
Ca²⁺, Mg²⁺ | Titrimetric (EDTA method) | Manual titration | |
Cl⁻, HCO₃⁻ | Titrimetric | Manual titration | |
SO₄²⁻, NO₃⁻, PO₄³⁻ | Turbidimetric | UV-Visible spectrophotometer | |
Na⁺, K⁺ | Flame photometric | Flame photometer | |
Microbial | Total coliform (TC) | Membrane Filtration | Autoclaved MF unit |
Fecal coliform (FC) | Membrane Filtration | Autoclaved MF unit | |
E. coli | Membrane Filtration | Autoclaved MF unit |
Index/Analysis | Formula/Model | Purpose | Classification/Threshold |
|---|---|---|---|
Water Quality Index (WQI) | i) WQI = ii) Qn = [ iii) Wn = K/ Sn iv) K = . | Composite evaluation of chemical safety | Excellent (0-25); Good (26-50); Poor (51-75); Very Poor (76-100); Unfit (>100) |
Pollution Index of Groundwater (PIG) | i) Wp = Rw/∑Rw ii) Sc = C/Ds iii) Ow= Wp× Sc iv) PIG = ∑Ow | Assess geogenic and anthropogenic pollution | Insignificant (<1); Low (1-1.5); Moderate (1.5-2); High (2-2.5); Very high (>2.5) |
Principal Component Analysis (PCA) | Eigenvalue decomposition of the correlation matrix | Identify dominant pollution sources | Factors with eigenvalue >1 considered significant |
Quantitative Microbial Risk Assessment (QMRA) | i) ii) iii) | Estimate microbial infection risk from E. coli | WHO benchmark: ≤10⁻⁴ annual risk |
Chemical Health-Risk Assessment | i) CDI= (CN×IR)/BW ii) HQ=CDI/RfD iii) Na intake (mg/day) = Na (mg/L) ×IR | Evaluate potential health risks from for nitrate (NO₃⁻), and sodium (Na⁺) intake | The WHO guideline for dietary sodium is <2,000 mg/day for adults. HQ < 1 indicates no significant health risk |
Halls | Sample ID | pH | EC | TDS | DO | Turbidity | Color |
|---|---|---|---|---|---|---|---|
Unit | - | µs/cm | mg/L | NTU | - | ||
BBFM Hall | BBFM1* | 8.07 | 876.32 | 410.33 | 3.12 | 1.3 | Colourless |
BBFM2 | 7.94 | 874.67 | 409.33 | 3.03 | 0.93 | ||
BBFM3 | 7.95 | 874.97 | 411.33 | 3.21 | 0.88 | ||
BBFM4 | 7.98 | 868.77 | 411.50 | 4.82 | 1.25 | ||
BBFM5 | 7.99 | 874.25 | 410.50 | 2.63 | 0.98 | ||
BBFM6 | 7.81 | 871.92 | 410.17 | 3.72 | 1.03 | ||
Mean | 7.96 | 873.48 | 410.53 | 3.42 | 1.06 | - | |
Std. | 0.08 | 2.72 | 0.80 | 0.77 | 0.17 | - | |
Max | 8.07 | 876.32 | 411.50 | 4.82 | 1.3 | - | |
Min | 7.81 | 868.77 | 409.33 | 2.63 | 0.88 | - | |
AP Hall | AP1 | 7.79 | 820.33 | 384.83 | 2.90 | 0.93 | Colourless |
AP2 | 7.83 | 825.35 | 387.50 | 3.51 | 1.5 | ||
AP3 | 7.86 | 825.00 | 386.33 | 3.21 | 0.83 | ||
Mean | 7.83 | 823.56 | 386.22 | 3.21 | 1.09 | - | |
Std. | 0.04 | 2.80 | 1.34 | 0.31 | 0.36 | - | |
Max | 7.86 | 825.35 | 387.50 | 3.51 | 1.5 | - | |
Min | 7.79 | 820.33 | 384.83 | 2.90 | 0.83 | - | |
Halls | Sample ID | Ca2+ | Mg2+ | Na+ | k+ | Cl- | HCO3- | NO3- | PO43- | SO42- |
|---|---|---|---|---|---|---|---|---|---|---|
Unit | mg/L | |||||||||
BBFM Hall | BBFM1* | 47.72 | 21.30 | 150.87 | 5.8 | 156.37 | 555.1 | 0.618 | 0.0162 | 3.34 |
BBFM2 | 50.99 | 23.52 | 150.58 | 5.38 | 177.42 | 500.2 | 0.715 | 0.0164 | 3.19 | |
BBFM3 | 64.77 | 21.80 | 169.70 | 3.15 | 172.45 | 506.3 | 0.913 | 0.0166 | 3.41 | |
BBFM4 | 46.14 | 20.53 | 160.94 | 6.45 | 177.37 | 524.6 | 0.762 | 0.0160 | 3.27 | |
BBFM5 | 48.13 | 15.95 | 169.93 | 4.75 | 161.21 | 518.5 | 0.745 | 0.0174 | 3.60 | |
BBFM6 | 42.81 | 22.27 | 140.12 | 3.53 | 143.21 | 481.9 | 0.813 | 0.0184 | 3.56 | |
Mean | 50.09 | 20.89 | 157.02 | 4.84 | 164.67 | 514.43 | 0.761 | 0.0168 | 3.39 | |
Std. | 7.67 | 2.62 | 11.90 | 1.30 | 13.61 | 24.90 | 0.099 | 0.0009 | 0.16 | |
Max | 64.77 | 23.52 | 169.93 | 6.45 | 177.42 | 555.1 | 0.913 | 0.0184 | 3.60 | |
Min | 42.81 | 15.95 | 150.58 | 3.15 | 143.21 | 481.9 | 0.618 | 0.0160 | 3.19 | |
AP Hall | AP1 | 57.29 | 21.53 | 132.90 | 4.77 | 154.65 | 469.7 | 0.603 | 0.0154 | 3.97 |
AP2 | 35.39 | 22.08 | 168.39 | 3.57 | 130.34 | 475.8 | 0.480 | 0.0168 | 3.81 | |
AP3 | 38.03 | 23.37 | 153.29 | 5.29 | 140.83 | 488 | 0.445 | 0.0171 | 3.55 | |
Mean | 43.57 | 22.33 | 151.53 | 4.54 | 141.94 | 477.83 | 0.510 | 0.0164 | 3.77 | |
Std. | 11.95 | 0.95 | 17.81 | 0.88 | 12.20 | 9.32 | 0.083 | 0.0009 | 0.21 | |
Max | 57.29 | 23.37 | 168.39 | 5.29 | 154.65 | 488 | 0.603 | 0.0171 | 3.97 | |
Min | 35.39 | 21.53 | 132.90 | 3.57 | 130.34 | 469.7 | 0.445 | 0.0154 | 3.55 | |
Para-meters | pH | EC | TDS | DO | Turbidity | Ca2+ | Mg2+ | Na+ | k+ | Cl- | HCO3- | NO3- | PO43- | SO42- |
|---|---|---|---|---|---|---|---|---|---|---|---|---|---|---|
pH | 1 | |||||||||||||
EC | 0.711 | 1 | ||||||||||||
TDS | 0.694 | 0.993 | 1 | |||||||||||
DO | 0.009 | 0.107 | 0.208 | 1 | ||||||||||
Turbidity | 0.166 | -0.050 | -0.015 | 0.431 | 1 | |||||||||
Ca2+ | 0.217 | 0.344 | 0.334 | -0.276 | -0.491 | 1 | ||||||||
Mg2+ | -0.403 | -0.306 | -0.329 | 0.178 | -0.072 | -0.107 | 1 | |||||||
Na+ | 0.451 | 0.246 | 0.266 | 0.076 | 0.268 | -0.056 | -0.419 | 1 | ||||||
k+ | 0.501 | 0.105 | 0.118 | 0.272 | 0.084 | -0.151 | -0.084 | -0.164 | 1 | |||||
Cl- | 0.585 | 0.647 | 0.663 | 0.144 | -0.306 | 0.678 | -0.177 | 0.141 | 0.408 | 1 | ||||
HCO3- | 0.971 | 0.691 | 0.682 | 0.101 | 0.235 | 0.144 | -0.376 | 0.318 | 0.543 | 0.492 | 1 | |||
NO3- | 0.300 | 0.789 | 0.817 | 0.165 | -0.282 | 0.655 | -0.270 | 0.150 | -0.240 | 0.667 | 0.266 | 1 | ||
PO43- | -0.193 | 0.252 | 0.241 | -0.030 | -0.115 | -0.428 | -0.107 | 0.133 | -0.478 | -0.411 | -0.164 | 0.184 | 1 | |
SO42- | -0.711 | -0.766 | -0.760 | -0.317 | 0.057 | -0.124 | -0.131 | -0.240 | -0.445 | -0.674 | -0.673 | -0.436 | -0.026 | 1 |
Para meters | WHO Std. | Unit weight | BBFM Hall (BBFM1 to BBFM6) | AP Hall (AP1 to AP3) | |||||||
|---|---|---|---|---|---|---|---|---|---|---|---|
(Wn) | 1 | 2 | 3 | 4 | 5 | 6 | 1 | 2 | 3 | ||
WnQn | WnQn | WnQn | WnQn | WnQn | WnQn | WnQn | WnQn | WnQn | |||
PH | 8.5 | 0.174 | 16.57 | 16.30 | 16.32 | 16.38 | 16.40 | 16.03 | 15.99 | 16.07 | 16.14 |
EC | 1500 | 0.001 | 0.06 | 0.06 | 0.06 | 0.06 | 0.06 | 0.06 | 0.05 | 0.05 | 0.05 |
TDS | 500 | 0.003 | 0.24 | 0.24 | 0.24 | 0.24 | 0.24 | 0.24 | 0.23 | 0.23 | 0.23 |
Turbidity | 5 | 0.297 | 7.71 | 5.52 | 5.22 | 7.42 | 5.81 | 6.11 | 5.52 | 8.90 | 4.92 |
DO | 8 | 0.185 | 7.23 | 7.02 | 7.44 | 11.17 | 6.09 | 8.62 | 6.72 | 8.13 | 7.44 |
Na+ | 200 | 0.007 | 0.56 | 0.56 | 0.63 | 0.60 | 0.63 | 0.52 | 0.49 | 0.62 | 0.57 |
K+ | 12 | 0.124 | 5.97 | 5.54 | 3.24 | 6.64 | 4.89 | 3.64 | 4.91 | 3.68 | 5.45 |
Ca2+ | 75 | 0.020 | 1.26 | 1.34 | 1.71 | 1.22 | 1.27 | 1.13 | 1.51 | 0.93 | 1.00 |
Mg2+ | 50 | 0.030 | 1.26 | 1.40 | 1.29 | 1.22 | 0.95 | 1.32 | 1.28 | 1.31 | 1.39 |
Cl- | 250 | 0.006 | 0.37 | 0.42 | 0.41 | 0.42 | 0.38 | 0.34 | 0.37 | 0.31 | 0.33 |
HCO3- | 120 | 0.012 | 5.72 | 5.15 | 5.21 | 5.40 | 5.34 | 4.96 | 4.84 | 4.90 | 5.03 |
SO42- | 250 | 0.006 | 0.01 | 0.01 | 0.01 | 0.01 | 0.01 | 0.01 | 0.01 | 0.01 | 0.01 |
NO3- | 11 | 0.135 | 0.76 | 0.88 | 1.12 | 0.93 | 0.91 | 1.00 | 0.74 | 0.59 | 0.55 |
∑Wn | 1.00 | ||||||||||
∑WnQn | 47.72 | 44.44 | 42.91 | 51.71 | 43.00 | 43.98 | 42.66 | 45.74 | 43.10 | ||
WQI= ∑WnQn/∑Wn | 47.72 | 44.44 | 42.91 | 51.71 | 43.00 | 43.98 | 42.66 | 45.74 | 43.10 | ||
WQI Status (25-50) with Rank | Good (B) | Good (B) | Good (B) | Poor (C) | Good (B) | Good (B) | Good (B) | Good (B) | Good (B) | ||
Principal Component | Eigenvalue (Total) | % Variance | Cumulative% Variance | Top Eigenvector Coefficients and associated variables |
|---|---|---|---|---|
PC1 | 5.578 | 39.84 | 39.84 | 0.926 (TDS), 0.919 (EC), 0.863 (pH), 0.823 (HCO₃⁻), 0.822 (Cl⁻), and –0.817 (SO₄²⁻) |
PC2 | 2.394 | 17.10 | 56.94 | 0.746 (Turbidity), 0.602 (K⁺), –0.689 (Ca²⁺), –0.567 (NO₃⁻), and 0.455 (DO) |
PC3 | 2.024 | 14.46 | 71.40 | 0.851 (PO₄³⁻), 0.493 (Na⁺), 0.282 (Turbidity), 0.267 (TDS), and 0.257 (EC) |
PC4 | 1.511 | 10.79 | 82.19 | 0.694 (Mg²⁺), 0.635 (DO), –0.383 (Na⁺), 0.291 (pH), and –0.192 (Ca²⁺) |
PC5 | 1.030 | 7.36 | 89.55 | 0.485 (DO), 0.421 (Turbidity), 0.316 (Na⁺), –0.143 (pH), and –0.071 (Mg²⁺) |
BBFM Hall (BBFM1 to BBFM6) | AP Hall (AP1 to AP3) | |||||||||||
|---|---|---|---|---|---|---|---|---|---|---|---|---|
Para meters | Ds | Rw | Wp | 1 | 2 | 3 | 4 | 5 | 6 | 1 | 2 | 3 |
WpSc* | WpSc | WpSc | WpSc | WpSc | WpSc | WpSc | WpSc | WpSc | ||||
PH | 8.5 | 3 | 0.075 | 0.071 | 0.070 | 0.070 | 0.070 | 0.071 | 0.069 | 0.069 | 0.069 | 0.069 |
EC | 1500 | 5 | 0.125 | 0.073 | 0.073 | 0.073 | 0.072 | 0.073 | 0.073 | 0.068 | 0.069 | 0.069 |
TDS | 500 | 5 | 0.125 | 0.103 | 0.102 | 0.103 | 0.103 | 0.103 | 0.026 | 0.023 | 0.097 | 0.097 |
DO | 8 | 2 | 0.050 | 0.020 | 0.019 | 0.020 | 0.030 | 0.016 | 0.023 | 0.018 | 0.022 | 0.020 |
Na+ | 200 | 4 | 0.100 | 0.075 | 0.075 | 0.085 | 0.080 | 0.085 | 0.070 | 0.066 | 0.084 | 0.077 |
K+ | 12 | 1 | 0.025 | 0.012 | 0.011 | 0.007 | 0.013 | 0.010 | 0.007 | 0.010 | 0.007 | 0.011 |
Ca2+ | 75 | 2 | 0.050 | 0.032 | 0.034 | 0.043 | 0.031 | 0.032 | 0.029 | 0.038 | 0.024 | 0.025 |
Mg2+ | 50 | 2 | 0.050 | 0.021 | 0.024 | 0.022 | 0.021 | 0.016 | 0.022 | 0.022 | 0.022 | 0.023 |
Cl- | 250 | 4 | 0.100 | 0.063 | 0.071 | 0.069 | 0.071 | 0.064 | 0.057 | 0.062 | 0.052 | 0.056 |
HCO3- | 120 | 3 | 0.075 | 0.347 | 0.313 | 0.316 | 0.328 | 0.324 | 0.301 | 0.294 | 0.297 | 0.305 |
SO42- | 250 | 4 | 0.100 | 0.001 | 0.001 | 0.001 | 0.001 | 0.001 | 0.001 | 0.002 | 0.002 | 0.001 |
NO3- | 11 | 5 | 0.125 | 0.007 | 0.008 | 0.010 | 0.009 | 0.008 | 0.009 | 0.007 | 0.005 | 0.005 |
∑Rw | 40 | |||||||||||
Wp= Rw/∑Rw | 1.00 | |||||||||||
∑Ow | 0.825 | 0.801 | 0.820 | 0.830 | 0.804 | 0.688 | 0.678 | 0.750 | 0.758 | |||
PIG = ∑Ow | 0.825 | 0.801 | 0.820 | 0.830 | 0.804 | 0.688 | 0.678 | 0.750 | 0.758 | |||
PIG Status (<1) | Insignificant Pollution | |||||||||||
Action Category | Specific Action | Timeframe (months) | Importance* | Practical Considerations | Key Remarks | Targeted Water Quality Indicators |
|---|---|---|---|---|---|---|
Immediate Actions | Boil water before drinking | <3 months | 5 | Focus on quick elimination of microbial risk | Easy to implement immediately and no infrastructure needed | TC, FC, E. coli |
Use point-of-use water filters (UV/ceramic) | 4 | Portable units recommended for residents | Filters should be maintained and replaced regularly | TC, FC, E. coli; Turbidity | ||
Chlorinate and clean storage tanks regularly | 5 | Prevent bacterial buildup in stored water | Requires staff training for proper dosing and cleaning | TC, FC, E. coli; Cl⁻ | ||
Short-to-Mid-Term Actions | Install UV water purifiers in common areas | 3–12 months | 3 | Chemical-free pathogen elimination | Requires electrical connection and maintenance | TC, FC, E. coli |
Centralized multi-stage filtration systems at entry points | 5 | Improves water quality | The initial investment is high and reduces long-term risk | TC, FC, E. coli; Turbidity; TDS, Na⁺, Cl⁻ | ||
Monthly water quality testing (microbial and chemical) | 4 | Monitoring ensures safe water consistently | Helps track trends and identify contamination early | pH, EC, TDS, DO, Turbidity, Na⁺, Cl⁻, TC, FC, E. coli | ||
Awareness campaigns on safe water handling and hygiene | 3 | Education supports behavior change | Increases compliance with water safety practices | TC, FC, E. coli (indirectly) | ||
Long-Term Actions | Replace or upgrade water supply lines | >12 months | 5 | Prevents leaks and contamination | May require significant planning and budget | TC, FC, E. coli; Turbidity; TDS, Na⁺, Cl⁻ |
Build onsite water treatment units | 5 | Ensures scalable purification | long-term investment that reduces dependency on external water sources | TC, FC, E. coli; Turbidity; TDS, Na⁺, Cl⁻; DO | ||
Improve drainage and waste management systems | 4 | Reduces environmental contamination risk | Supports overall environmental health and sustainability | TC, FC, E. coli; NO₃⁻, PO₄³⁻; Turbidity |
BBFM | Bangamata Begum Fazilatunnessa Mujib Hall |
AP | Aparajita Hall |
WQI | Water Quality Index |
PCA | Principal Component Analysis |
PIG | Pollution Index of Groundwater |
QMRA | Quantitative Microbial Risk Assessment |
EC | Electrical Conductivity |
TDS | Total Dissolve Solid |
TC | Total Coliform |
FC | Fecal Coliform |
WHO | World Health Organization |
HQ | Hazard Quotient |
Sample ID | E. coli (CFU/100 mL) | Adjusted dose d (CFU) | P_inf | P_Annual | P_Annual (%) |
|---|---|---|---|---|---|
BBFM1 | 3 | 0.075 | 0.000367 | 0.125420 | 12.54 |
BBFM2 | 10 | 0.250 | 0.001221 | 0.359686 | 35.97 |
BBFM3 | 5 | 0.125 | 0.000611 | 0.200063 | 20.01 |
BBFM4 | 8 | 0.200 | 0.000977 | 0.300119 | 30.01 |
BBFM5 | 13 | 0.325 | 0.001585 | 0.439560 | 43.96 |
BBFM6 | 6 | 0.150 | 0.000733 | 0.234931 | 23.49 |
AP1 | 4 | 0.100 | 0.000489 | 0.163585 | 16.36 |
AP2 | 6 | 0.150 | 0.000733 | 0.234931 | 23.49 |
AP3 | 5 | 0.125 | 0.000611 | 0.200063 | 20.01 |
Sample ID | NO₃⁻ (mg/L) | NO₃ as N (mg N/L) | CDI (mg/kg-day) | HQ | Na (mg/L) | Na intake (mg/day) | % of WHO 2000 mg/day |
|---|---|---|---|---|---|---|---|
BBFM1 | 0.618 | 0.13955 | 0.00465 | 0.00291 | 150.87 | 301.74 | 15.09 |
BBFM2 | 0.715 | 0.16145 | 0.00538 | 0.00336 | 150.58 | 301.16 | 15.06 |
BBFM3 | 0.913 | 0.20616 | 0.00687 | 0.00429 | 169.70 | 339.40 | 16.97 |
BBFM4 | 0.762 | 0.17207 | 0.00574 | 0.00359 | 160.94 | 321.88 | 16.09 |
BBFM5 | 0.745 | 0.16823 | 0.00561 | 0.00350 | 169.93 | 339.86 | 16.99 |
BBFM6 | 0.813 | 0.18358 | 0.00612 | 0.00383 | 140.12 | 280.24 | 14.01 |
AP1 | 0.603 | 0.13616 | 0.00454 | 0.00284 | 132.90 | 265.80 | 13.29 |
AP2 | 0.480 | 0.10839 | 0.00361 | 0.00226 | 168.39 | 336.78 | 16.84 |
AP3 | 0.445 | 0.10048 | 0.00335 | 0.00210 | 153.29 | 306.58 | 15.33 |
| [1] | Oliveira, C. M. D. (2017). Sustainable access to safe drinking water: fundamental human right in the international and national scene. Revista Ambiente & Água, 12(6), 985-1000. |
| [2] | Pal, M., Ayele, Y., Hadush, M., Panigrahi, S., & Jadhav, V. J. (2018). Public health hazards due to unsafe drinking water. Air Water Borne Dis, 7(1000138), 2. |
| [3] | Khondoker, M., Mandal, S., Gurav, R., & Hwang, S. (2023). Freshwater shortage, salinity increase, and global food production: A need for sustainable irrigation water desalination-A scoping review. Earth, 4(2), 223-240. |
| [4] | Swarnokar, S. C., Hassan, N., Rahman, M., Islam, M. M., & Ara, M. H. (2019). Assessment of groundwater quality in a Tidal River basin of the Ganges Delta in Bangladesh. Journal of Geoscience and Environment Protection, 7(5), 131-151. |
| [5] | Scanlon, B. R., Fakhreddine, S., Rateb, A., de Graaf, I., Famiglietti, J., Gleeson, T.,... & Zheng, C. (2023). Global water resources and the role of groundwater in a resilient water future. Nature Reviews Earth & Environment, 4(2), 87-101. |
| [6] | Mukherjee, A., Scanlon, B. R., Aureli, A., Langan, S., Guo, H., & McKenzie, A. (2021). Global groundwater: from scarcity to security through sustainability and solutions. In Global groundwater (pp. 3-20). Elsevier. |
| [7] | Mou, S. I., Swarnokar, S. C., Ghosh, S., Ridwan, M. T., & Ishtiak, K. F. (2023). Assessment of Drinking Water Quality Served in Different Restaurants at Islam Nagor Road Adjacent to Khulna University Campus, Bangladesh. Journal of Geoscience and Environment Protection, 11, 252-267. |
| [8] | Mekonnen, M. M., & Hoekstra, A. Y. (2016). Four billion people facing severe water scarcity. Science Advances, 2(2), e1500323. |
| [9] |
Food and Agriculture Organization of the United Nations; UN-Water. (2023, May 1). National water roadmaps to tackle scarcity and meet the SDGs. Press release. UN-Water.
https://www.unwater.org/news/fao-national-water-roadmaps-tackle-scarcity-and-meet-sdgs UN-Water |
| [10] | UN-Water. (2024). Water facts-water scarcity. |
| [11] | Richey, A. S., Thomas, B. F., Lo, M. H., Reager, J. T., Famiglietti, J. S., Voss, K., Swenson, S., & Rodell, M. (2015). Quantifying renewable groundwater stress with GRACE. Water Resources Research, 51(7), 5217–5238. |
| [12] | du Plessis, A. (2023). Water resources from a global perspective. In South Africa’s Water predicament: Freshwater’s unceasing decline (pp. 1-25). Cham: Springer International Publishing. |
| [13] | Mishra, B. K., Kumar, P., Saraswat, C., Chakraborty, S., & Gautam, A. (2021). Water security in a changing environment: Concept, challenges and solutions. Water, 13(4), 490. |
| [14] | Howlader, M., Mamun, A. M., Rahman, M. M., Rahman, M. H., Swarnokar, S. C., Sultana, M.,... & Das, T. K. (2025). Spatial characteristics and health risks assessments of trace metal pollution from road dusts in the industrialized city of Bangladesh. Heliyon. |
| [15] | Swarnokar, S. C., Mou, S. I., Sharmi, S. D., Iftikhar, A., & Jesmin, S. (2025). Climate-induced risks, adaptation, and mitigation responses: a comparative study on climate-stressed coastal communities. Frontiers in Climate, 7, 1553579. |
| [16] | WHO. (2018). Guidelines for drinking-water quality (4th ed., incorporating the 1st addendum). World Health Organization. |
| [17] | Mou, S. I., Paul, R., Haque, F., & Swarnokar, S. C. (2025). Water Supply and Sanitation Crisis in Joragate Railway Slum, Khulna: A Study on Groundwater Quality, Hygiene Practices, and Health Risks. American Journal of Environmental Protection, 14(5), 181-196. |
| [18] | Al Masud, M. M., Moni, N. N., Azad, A. K. and Swarnokar, S. C. (2018). Impact of Tidal River Management on Livestock in the Ganges - Brahmaputra Basin, Journal of Dairy & Veterinary Sciences, 6(5): 1-9. |
| [19] | Saxena, V. (2025). Water quality, air pollution, and climate change: investigating the environmental impacts of industrialization and urbanization. Water, Air, & Soil Pollution, 236(2), 73. |
| [20] | Kormoker, T., Hossain, M. M., Kabir, M. H., Rahman, M. A., Jahan, I., & Hasan, M. (2022). Hydrochemical characteristics and groundwater quality assessment for drinking and irrigation purposes in coastal aquifers of Bangladesh. Groundwater for Sustainable Development, 17, 100732. |
| [21] | Shamimuzzaman, M., Nayeem, R. H., Ara, N., Rahman, M. M., Jahid, M. I. K. and Hasan, M. N. (2019). Physico-Chemical and Microbiological Quality Assessment of Supply Water around Dhaka City, Bangladesh. Journal of Water Resource and Protection, 11, 280-295. |
| [22] | WHO. (2023). Burden of disease attributable to unsafe drinking-water, sanitation and hygiene, 2019 update. World Health Organization (WHO). |
| [23] | Das, K., Mukherjee, A., Malakar, P., Das, P., & Dey, U. (2021). Impact of global-scale hydroclimatic patterns on surface water-groundwater interactions in the climatically vulnerable Ganges river delta of the Sundarbans. Science of The Total Environment, 798, 149198. |
| [24] | Priyan, K. (2021). Issues and challenges of groundwater and surface water management in semi-arid regions. Groundwater resources development and planning in the semi-arid region, 1-17. |
| [25] |
Swarnokar, S. C., Kumar, U., Rahman, M. M., Mou, S. I., & Ishtiak, K. F. (2024). Aquaculture Practices in the Saline-Prone Coastal Region of Bangladesh: Opportunities and Threats for Socio-Economic and Environmental Aspects. In New Advancements in Geomorphological Research: Issues and Challenges in Quantitative Spatial Science (pp. 409-421). Cham: Springer Nature Switzerland.
https://link.springer.com/chapter/10.1007/978-3-031-64163-3_23 |
| [26] | Yannopoulos, S., Giannopoulou, I., & Kaiafa-Saropoulou, M. (2019). Investigation of the current situation and prospects for the development of rainwater harvesting as a tool to confront water scarcity worldwide. Water, 11(10), 2168. |
| [27] | Hossain, M. J., Rahman, M. Z., Kamal, A. M., Chowdhury, M. A., Hossain, M. S., Rahman, M. M.,... & Islam, A. R. M. T. (2024). Quantitative and qualitative assessment of groundwater resources for drinking water supply in the peri-urban area of Dhaka, Bangladesh. Groundwater for Sustainable Development, 25, 101146. |
| [28] | Fayshal, M. A., Jarin, T. T., Ullah, M. R., Rahman, S. A., Siddque, A. A., & Siddique, I. M. (2023). A comprehensive review of drain water pollution potential and environmental control strategies in Khulna, Bangladesh. Journal of Water Resources and Pollution Studies, 8(3), 41-54. |
| [29] | Ferdous Hoque, S. (2023). Socio-spatial and seasonal dynamics of small, private water service providers in Khulna district, Bangladesh. International Journal of Water Resources Development, 39(1), 89-112. |
| [30] | Akter, T., Jhohura, F. T., Akter, F., Chowdhury, T. R., Mistry, S. K., Dey, D., Barua, M. K., & Rahman, M. (2016). Water quality index for measuring drinking water quality in rural Bangladesh: A cross-sectional study. Journal of Health, Population and Nutrition, 35(1), 4. |
| [31] | Mahmud, A., Sikder, S., & Joardar, J. C. (2020). Assessment of groundwater quality in Khulna city of Bangladesh in terms of water quality index for drinking purpose. Applied Water Science, 10, 1-14. |
| [32] | Tang, L., Rhoads, W. J., Eichelberg, A., Hamilton, K. A., & Julian, T. R. (2024). Applications of quantitative microbial risk assessment to respiratory pathogens and implications for uptake in policy: a state-of-the-science review. Environmental health perspectives, 132(5), 056001. |
| [33] | Hamilton, K. A., Ciol Harrison, J., Mitchell, J., Weir, M., Verhougstraete, M., Haas, C. N.,... & Rose, J. B. (2024). Research gaps and priorities for quantitative microbial risk assessment (QMRA). Risk analysis, 44(11), 2521-2536. |
| [34] | Bishwakarma, K., Wang, G., Zhang, F., Pant, R. R., Adhikari, S., & Saqr, A. M. (2025). Hydrogeochemical controlling mechanism and associated health risk assessment of trace elements in the Koshi River Basin, Central Himalaya. Environmental Monitoring and Assessment, 197(9), 1-18. |
| [35] | Xie, Y., Zhao, H., Qian, Y., & Wu, S. (2017). Application of QMRA in water safety management: A review. Water, 9(8), 641. |
| [36] | APHA (2017). Standard methods for the examination of water and wastewater (23rd ed.). American Public Health Association. |
| [37] | Ramesh, R. M. and Anbu, M. (1996). Chemical Methods for Environmental Analysis Water and Sediment. MacMilan India Limited Publication, 15-67. |
| [38] | Brown, E., Skougstad, M. W., & Fishman, M. J. (1970). Methods for collection and analysis of water samples for dissolved minerals and gases (No. 05-A1). US Govt. Print. Off. |
| [39] | Cude, C. G. (2001). Oregon Water Quality Index a Tool for Evaluating Water Quality Management Effectiveness’. Journal of the American Water Resources Association, 37(1), 125–137. |
| [40] | Tyagi, S., Sharma, B., Singh, P., & Dobhal, R. (2013). Water quality assessment in terms of water quality index. American Journal of water resources, 1(3), 34-38. |
| [41] | Rao, N. S., Sunitha, B., Rambabu, R., Rao, P. N., Rao, P. S., Spandana, B. D.,... & Marghade, D. (2018). Quality and degree of pollution of groundwater, using PIG from a rural part of Telangana State, India. Applied Water Science, 8(8), 227. |
| [42] | Pant, R. R., Zhang, F., Qaiser, F. U. R., Varol, M., Adhikari, D., Wang, G.,... & Bishwakarma, K. (2025). Trace elements in fluvial sediments of the Gandaki River Basin, Central Himalaya, Nepal: distribution, sources, and risk assessment. Journal of Soils and Sediments, 25(8), 2463-2480. |
| [43] | Kopec, B. G., Feng, X., Posmentier, E. S., Chipman, J. W., & Virginia, R. A. (2018). Use of principal component analysis to extract environmental information from lake water isotopic compositions. Limnology and Oceanography, 63(3), 1340-1354. |
| [44] | Fatima, S. U., Khan, M. A., Siddiqui, F., Mahmood, N., Salman, N., Alamgir, A., & Shaukat, S. S. (2022). Geospatial assessment of water quality using principal components analysis (PCA) and water quality index (WQI) in Basho Valley, Gilgit Baltistan (Northern Areas of Pakistan). Environmental Monitoring and Assessment, 194(3), 151. |
| [45] | Heida, A., Hamilton, M. T., Gambino, J., Sanderson, K., Schoen, M. E., Jahne, M. A.,... & Hamilton, K. A. (2025). Population Ecology-Quantitative Microbial Risk Assessment (QMRA) Model for Antibiotic-Resistant and Susceptible E. coli in Recreational Water. Environmental science & technology, 59(9), 4266-4281. |
| [46] | WHO (2017). Guidelines for drinking-water quality: Fourth edition incorporating the first addendum. |
| [47] | Malik, A., Yasar, A., Tabinda, A. B., Iftikhar, M. H., & Mukhtar, S. (2024). Health risk assessment of nitrates and fluorides ingestion and geochemical evaluation of groundwater characteristics in semi-arid regions. International Journal of Environmental Science and Technology, 21(13), 8459-8486. |
| [48] | Islam, M. M., Marandi, A., Fatema, S., Zahid, A., & Schüth, C. (2019). The evolution of the groundwater quality in the alluvial aquifers of the south-western part of Bengal Basin, Bangladesh. Environmental Earth Sciences, 78(24), 705. |
| [49] | Mahmud, Z. H., Islam, M. S., Imran, K. M., Hakim, S. A. I., Worth, M., Ahmed, A.,... & Ahmed, N. (2019). Occurrence of Escherichia coli and faecal coliforms in drinking water at source and household point-of-use in Rohingya camps, Bangladesh. Gut pathogens, 11(1), 52. |
| [50] | Islam, M. T., Rahman, M. M., & Ahmed, S. (2022). Quantitative microbial risk assessment of drinking water in urban slums of Dhaka, Bangladesh. Environmental Monitoring and Assessment, 194(5), 345. |
| [51] | Rahman, M. T. U., Rasheduzzaman, M., Habib, M. A., Ahmed, A., Tareq, S. M., & Muniruzzaman, S. M. (2017). Assessment of fresh water security in coastal Bangladesh: An insight from salinity, community perception and adaptation. Ocean & Coastal Management, 137, 68-81. |
| [52] | Ashrafuzzaman, M., Artemi, C., Santos, F. D., & Schmidt, L. (2022). Current and future salinity intrusion in the south-western coastal region of Bangladesh. Spanish Journal of Soil Science, 12, 10017. |
| [53] | Nagarajan, R., Rajmohan, N., Mahendran, U., & Senthamilkumar, S. (2010). Evaluation of groundwater quality and its suitability for drinking and agricultural use in Thanjavur city, Tamil Nadu, India. Environmental monitoring and assessment, 171, 289-308. |
| [54] | Slavik, I., Oliveira, K. R., Cheung, P. B., & Uhl, W. (2020). Water quality aspects related to domestic drinking water storage tanks and consideration in current standards and guidelines throughout the world–a review. Journal of water and health, 18(4), 439-463. |
| [55] | Sarker, M. M. R., Hermans, T., Van Camp, M., Hossain, D., Islam, M., Ahmed, N.,... & Walraevens, K. (2022). Identifying the major hydrogeochemical factors governing groundwater chemistry in the coastal aquifers of Southwest Bangladesh using statistical analysis. Hydrology, 9(2), 20. |
| [56] | Uddin, M. R., Khandaker, M. U., Ahmed, S., Abedin, M. J., Hossain, S. M. M., Al Mansur, M. A.,... & Idris, A. M. (2024). Assessment of coastal river water quality in Bangladesh: Implications for drinking and irrigation purposes. Plos one, 19(4), e0300878. |
| [57] | Dasgupta, S., Akhter Kamal, F. A. R. H. A. N. A., HUQUE KHAN, Z. A. H. I. R. U. L., Choudhury, S., & Nishat, A. (2015). River salinity and climate change: evidence from coastal Bangladesh. In World scientific reference on Asia and the world economy (pp. 205-242). |
| [58] | Lassiter, A. (2021). Rising seas, changing salt lines, and drinking water salinization. Current Opinion in Environmental Sustainability, 50, 208-214. |
| [59] | Sarker, M. M. R., Van Camp, M., Islam, M., Ahmed, N., & Walraevens, K. (2018). Hydrochemistry in coastal aquifer of southwest Bangladesh: origin of salinity. Environmental earth sciences, 77(2), 39. |
| [60] | Wali, S. U., Usman, A. A., Usman, A. B., Abdullahi, U., Mohammed, I. U., & Hayatu, J. M. (2024). Impact of geology on hydrogeological and hydrochemical characteristics of groundwater in tropical environments: a narrative review. Int J Hydro, 8(6), 202-221. |
| [61] | Li, X., Zhang, Y., Wu, T., Sun, X., Yang, T., Wang, L.,... & Yu, H. (2020). Major ions in drinking and surface waters from five cities in arid and semi-arid areas, NW China: spatial occurrence, water chemistry, and potential anthropogenic inputs. Environmental Science and Pollution Research, 27(5), 5456-5468. |
| [62] | Gao, Z., Huang, T., Chen, J., Tian, H., Tan, M., Niu, Y., & Lou, K. (2025). Comprehensive Hydrochemical Analysis, Controlling Mechanisms, and Water Quality Assessment of Surface and Groundwater in a Typical Intensive Agricultural Area, Northern China. Water, 17(2), 276. |
| [63] | Zhao, G., Sheng, Y., Wang, W., Liu, Q., Jiang, M., & Li, Z. (2020). Effects of suspended particular matters, excess PO43-, and salinity on phosphorus speciation in coastal river sediments. Environmental Science and Pollution Research, 27(22), 27697-27707. |
| [64] | Missimer, T. M., & Maliva, R. G. (2025). Salinity Barriers to Manage Saltwater Intrusion in Coastal Zone Aquifers During Global Climate Change: A Review and New Perspective. Water, 17(11), 1651. |
| [65] | Islam, M. S., Siddika, A., Khan, M. N. H., Goldar, M. M., Sadique, M. A., Kabir, A. N. M. H., Huq, A., & Colwell, R. R. (2017). Microbiological analysis of tube-well water from urban and rural areas of Bangladesh. Applied and Environmental Microbiology, 73(2), 436–441. |
| [66] | Rahman, M. M., Ng, J. C., & Naidu, R. (2018). Chronic exposure of arsenic via drinking water and its adverse health impacts on humans. Environmental Geochemistry and Health, 31(1), 189–200. |
| [67] | Ashraf, F., Chowdhury, F. R., & Haque, R. (2020). Microbial quality of drinking water in urban Bangladesh: Risks and mitigation strategies. Journal of Water and Health, 18(2), 245–258. |
APA Style
Mou, S. I., Prachi, H. S., Swarnokar, S. C., Begum, S. (2025). Drinking Water Quality Assessment in Groundwater-Fed Supply Systems: A Case Study of Female Residential Halls at Khulna University, Bangladesh. Journal of Water Resources and Ocean Science, 14(6), 229-247. https://doi.org/10.11648/j.wros.20251406.16
ACS Style
Mou, S. I.; Prachi, H. S.; Swarnokar, S. C.; Begum, S. Drinking Water Quality Assessment in Groundwater-Fed Supply Systems: A Case Study of Female Residential Halls at Khulna University, Bangladesh. J. Water Resour. Ocean Sci. 2025, 14(6), 229-247. doi: 10.11648/j.wros.20251406.16
@article{10.11648/j.wros.20251406.16,
  author = {Sadia Islam Mou and Hridita Sarker Prachi and Sadhon Chandra Swarnokar and Salma Begum},
  title = {Drinking Water Quality Assessment in Groundwater-Fed Supply Systems: A Case Study of Female Residential Halls at Khulna University, Bangladesh},
  journal = {Journal of Water Resources and Ocean Science},
  volume = {14},
  number = {6},
  pages = {229-247},
  doi = {10.11648/j.wros.20251406.16},
  url = {https://doi.org/10.11648/j.wros.20251406.16},
  eprint = {https://article.sciencepublishinggroup.com/pdf/10.11648.j.wros.20251406.16},
  abstract = {Securing safe drinking water remains a pressing public health challenge in Bangladesh, where groundwater quality is increasingly undermined by a combination of natural factors and human-induced activities. This study examined the drinking water quality of two female residential halls such as Bangamata Begum Fazilatunnessa Mujib (BBFM) Hall and Aparajita Hall (AP) at Khulna University over a six-month period. An integrated approach was applied, combining physico-chemical and microbial analyses with multivariate and risk assessment methods such as Pearson’s correlation, Water Quality Index (WQI), Principal Component Analysis (PCA), Pollution Index of Groundwater (PIG), Quantitative Microbial Risk Assessment (QMRA) and Chemical Health Risk Assessment. Physical analyses indicated neutral to slightly alkaline water, with moderate electrical conductivity (EC) and total dissolved solids (TDS) reflecting natural geogenic influences. Chemical evaluation revealed a sodium-chloride-bicarbonate-dominated profile, while nitrate, phosphate, and sulfate remained within safe limits, though salinity indicators highlight potential long-term risks. Microbiological assessment detected total coliform (TC), fecal coliform (FC) and Escherichia coli (E. coli ) above World Health Organization (WHO) thresholds, indicating fecal contamination and immediate public health concerns. PCA and correlation analyses identified salinity, carbonate buffering, and phosphorus enrichment as key hydrochemical drivers, whereas the WQI ranged from 42.66 to 51.71, classifying most samples (except BBFM 4) as good. The PIG values (<1.0) indicated insignificant pollution. QMRA estimated annual infection probabilities of 12% to 44%, far above the WHO benchmark (≤10⁻⁴), underscoring cumulative exposure risks. Chemical health risk assessment confirmed no significant non-carcinogenic threat from nitrate or sodium intake. These results indicate that although the water is largely safe from a chemical standpoint, it carries considerable microbial health risks. Based on these findings, a comprehensive management approach is advised, incorporating immediate actions, short to mid-term interventions, and long-term infrastructural improvements, alongside the implementation of a Water Safety Plan (WSP) to ensure safe and sustainable drinking water in university residential facilities.},
 year = {2025}
}
TY  - JOUR
T1  - Drinking Water Quality Assessment in Groundwater-Fed Supply Systems: A Case Study of Female Residential Halls at Khulna University, Bangladesh
AU  - Sadia Islam Mou
AU  - Hridita Sarker Prachi
AU  - Sadhon Chandra Swarnokar
AU  - Salma Begum
Y1  - 2025/12/30
PY  - 2025
N1  - https://doi.org/10.11648/j.wros.20251406.16
DO  - 10.11648/j.wros.20251406.16
T2  - Journal of Water Resources and Ocean Science
JF  - Journal of Water Resources and Ocean Science
JO  - Journal of Water Resources and Ocean Science
SP  - 229
EP  - 247
PB  - Science Publishing Group
SN  - 2328-7993
UR  - https://doi.org/10.11648/j.wros.20251406.16
AB  - Securing safe drinking water remains a pressing public health challenge in Bangladesh, where groundwater quality is increasingly undermined by a combination of natural factors and human-induced activities. This study examined the drinking water quality of two female residential halls such as Bangamata Begum Fazilatunnessa Mujib (BBFM) Hall and Aparajita Hall (AP) at Khulna University over a six-month period. An integrated approach was applied, combining physico-chemical and microbial analyses with multivariate and risk assessment methods such as Pearson’s correlation, Water Quality Index (WQI), Principal Component Analysis (PCA), Pollution Index of Groundwater (PIG), Quantitative Microbial Risk Assessment (QMRA) and Chemical Health Risk Assessment. Physical analyses indicated neutral to slightly alkaline water, with moderate electrical conductivity (EC) and total dissolved solids (TDS) reflecting natural geogenic influences. Chemical evaluation revealed a sodium-chloride-bicarbonate-dominated profile, while nitrate, phosphate, and sulfate remained within safe limits, though salinity indicators highlight potential long-term risks. Microbiological assessment detected total coliform (TC), fecal coliform (FC) and Escherichia coli (E. coli ) above World Health Organization (WHO) thresholds, indicating fecal contamination and immediate public health concerns. PCA and correlation analyses identified salinity, carbonate buffering, and phosphorus enrichment as key hydrochemical drivers, whereas the WQI ranged from 42.66 to 51.71, classifying most samples (except BBFM 4) as good. The PIG values (<1.0) indicated insignificant pollution. QMRA estimated annual infection probabilities of 12% to 44%, far above the WHO benchmark (≤10⁻⁴), underscoring cumulative exposure risks. Chemical health risk assessment confirmed no significant non-carcinogenic threat from nitrate or sodium intake. These results indicate that although the water is largely safe from a chemical standpoint, it carries considerable microbial health risks. Based on these findings, a comprehensive management approach is advised, incorporating immediate actions, short to mid-term interventions, and long-term infrastructural improvements, alongside the implementation of a Water Safety Plan (WSP) to ensure safe and sustainable drinking water in university residential facilities.
VL  - 14
IS  - 6
ER  -
Environmental Science Discipline, Khulna University, Khulna, Bangladesh
Environmental Science Discipline, Khulna University, Khulna, Bangladesh
Environmental Science Discipline, Khulna University, Khulna, Bangladesh
Environmental Science Discipline, Khulna University, Khulna, Bangladesh
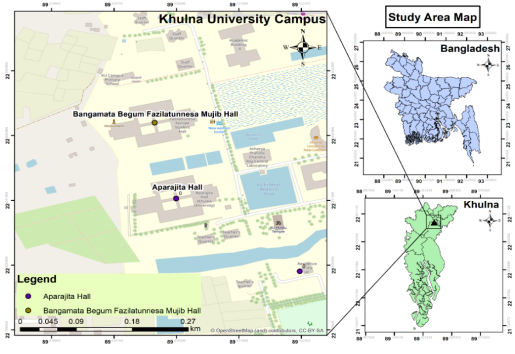
Figure 1. Location of the female students' hall, Khulna University.
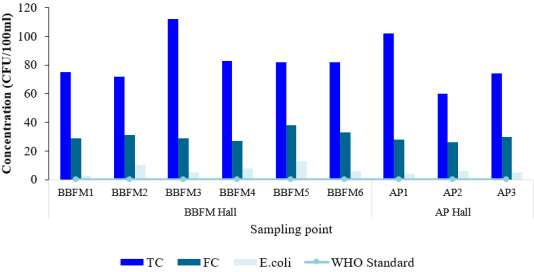
Figure 2. Microbial parameters of water from two hall along with WHO standard.
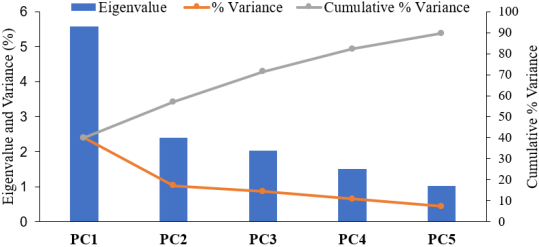
Figure 3. Scree plot for principal component analysis of physico-chemical parameters.
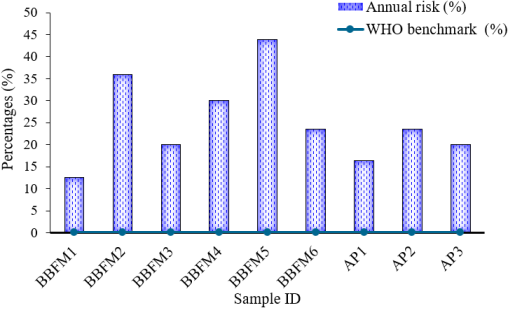
Figure 4. Quantitative Microbial Risk Assessment of samples showing annual risk percentages.
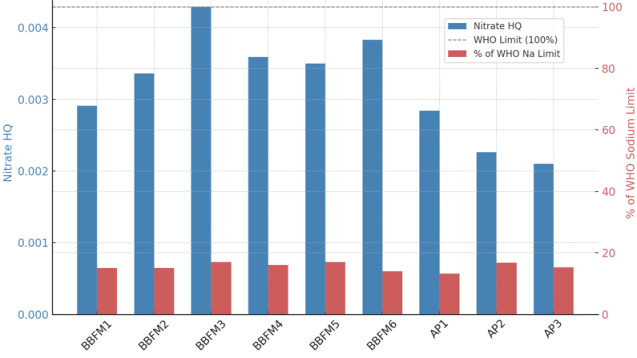
Figure 5. Health Risk Assessment of Nitrate and Sodium in Water from Two Residential Halls: Chemical and Salinity Impacts.